10 best Linux apps for network administration
Last Updated on May 21, 2024 by Jhonni Jets
As a Linux network administrator, you need powerful yet easy-to-use tools to keep your networks running smoothly. Whether you’re managing servers, workstations, routers, switches or other networked devices, your software arsenal is crucial for maintaining network stability, security and performance. This article will explore the 10 most useful Linux apps for network administration tasks like monitoring, configuration, troubleshooting and more.
Nagios

Table of Content
Nagios is one of the most popular network monitoring systems for Linux. It allows you to monitor servers, switches, applications and services to check their availability and alert you to any issues. Nagios can monitor network resources via simple host checks that test host availability and service checks that test specific services/ports. It has a web-based interface for viewing status reports and is highly configurable, allowing you to customize checks, notifications and more. Nagios works out of the box but also has thousands of plugins to monitor almost any system. It’s free and open source, making it a great choice for network monitoring on a budget.
Munin

While Nagios excels at monitoring availability, Munin is better for collecting and graphing system metrics over time. It pulls statistical data from nodes and presents it in an easy-to-interpret graphical interface. Munin can monitor CPU usage, disk space, memory usage, network traffic and more. Its plugins are simple to write in Perl or Python. Administrators can view historical charts to spot trends, bottlenecks and anomalies. Munin also has a highly scalable architecture that can monitor hundreds or thousands of systems simultaneously. It integrates seamlessly with Nagios to leverage Nagios’ alerting capabilities for metrics that exceed thresholds. Munin is lightweight, easy to set up and perfect for performance and capacity monitoring.
PRTG Network Monitor

While Nagios and Munin are excellent open source choices, PRTG Network Monitor offers a robust feature set for network monitoring without complexity. It features a elegant web-based interface and is simple to deploy, use and maintain. PRTG can monitor network devices, servers, applications and services via its extensive device and sensor library. It performs agentless monitoring via SNMP, WMI, IPMI and other protocols without installing software. PRTG also supports custom device and sensor development via its programming language. It provides real-time traffic graphs, device maps, geo-location views and customizable dashboards. For notification, PRTG can send alerts to network operations centers, pager services and more. The free version can monitor 100 sensors but many find the paid tiers worthwhile for expanded scalability.
Zabbix

Zabbix is another full-featured, enterprise-level network monitoring software similar to Nagios. It performs both passive and active monitoring of network parameters and sends alerts for any issues detected. Zabbix’s low overhead design allows it to scale to thousands of network elements. It features an SQL database and flexible templating for efficient configuration and management. The web-based interface provides an bird’s-eye view into overall network health alongside detailed device and host reports. Zabbix supports monitoring via SNMP, IPMI, JMX and other protocols. Its scripting functionality allows checking any metrics. Zabbix integrates with mobile apps, virtual environments and other systems. It offers powerful reporting and flexible alerting through email, SMS, and external scripts. Zabbix provides advanced monitoring capabilities for mid-sized to large deployments.
SNMP Network Monitor (SNMPing)

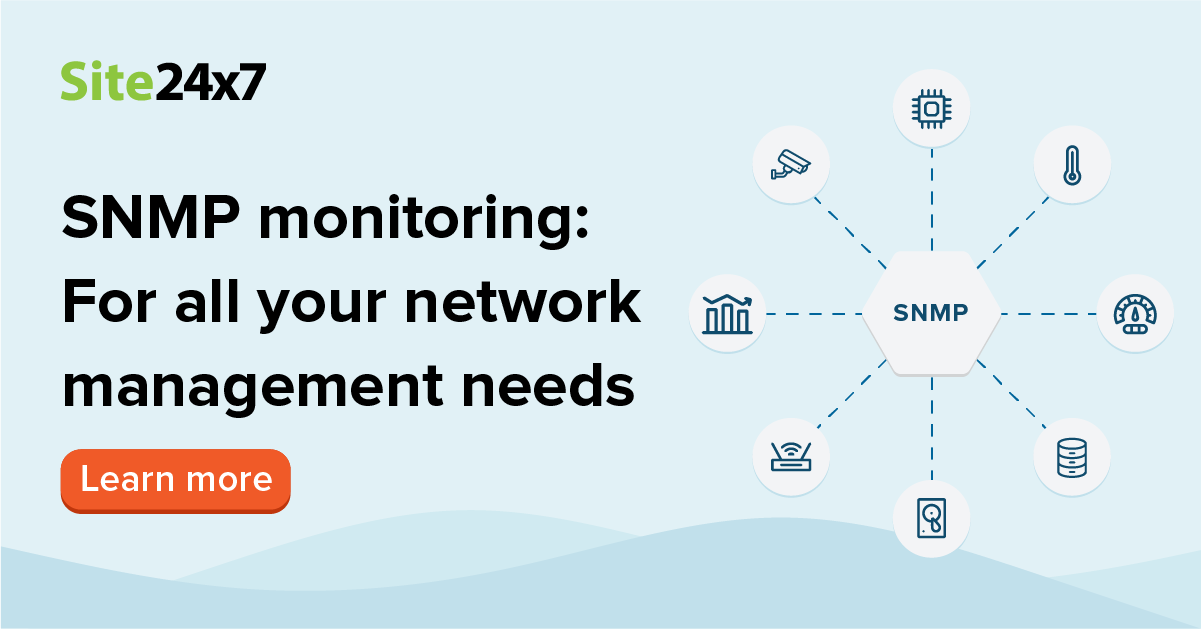
For basic SNMP monitoring, SNMPing is a great lightweight option. This open source tool queries SNMP devices for vital statistics like bandwidth usage, CPU load and memory usage. It polls devices on a schedule and records data for graphical display and trend analysis. SNMPing outputs data to common formats like RRDtool to integrate with other tools. Its intuitive GUI shows real-time and historic data in an easy-to-read dashboard. SNMPing can monitor many devices simultaneously without much overhead and is designed for simple deployments. It brings major monitoring power to basic networks while requiring minimal configuration or resources. For SNMP-based needs, SNMPing remains a popular choice among Linux network admins.
Cacti

Cacti is another open source network monitoring and graphing tool patterned after RRDtool. Like Munin, it specializes in collecting and displaying system metrics over extended time periods rather than simple availability. Cacti retrieves data via SNMP and stores it in an RRD database for graphing. Its web interface provides easy access to graphs of traffic, disk usage, memory statistics and other performance indicators. Administrators can add new data templates for seamless device integration. Advanced features include templates, data aggregation, alarm definitions and report generation. Cacti has a low learning curve and handles the load of monitoring hundreds or thousands of devices concurrently. For metrics-focused monitoring, Cacti delivers stable, scalable reporting at no cost.
Observium

Observium takes an easy-to-use agentless approach like PRTG but with more power and flexibility. It leverages SNMP, ICMP and other protocols to monitor network components, servers, switches and links. Observium automatically detects network devices and configures monitoring profiles. It provides real-time dashboards and maps, historical graphs, flexible templates and customizable reports. Administrators appreciate features like threshold-based notifications, customizable data storage, role-based access controls and an API. Observium scales well and is optimized for mid-sized to very large networks. Its transparent licensing model makes it suitable for both home labs and businesses. Overall, Observium offers rich monitoring functionality with low administrative overhead.
Smokeping

Specializing in network latency and bandwidth monitoring, Smokeping graphs ping responses between nodes on your network or the internet. It sends ICMP echo requests to track network performance trends over time. Smokeping stores results in an RRD database for web-accessible graphs. These graphs make it easy to spot degradations or problems anywhere along communication paths. Customizable front-ends allow filtering and aggregation of specific network paths. Smokeping integrates seamlessly with Munin, Cacti and other tools to provide a comprehensive view of network health. For tracking packet transit times, traceroutes and chokepoints, Smokeping remains the preferred open source solution among Linux admins.
NfSen

Specialized network flow monitoring is crucial for traffic analysis, security investigations and capacity planning. NfSen (formerly NFDUMP) collects netflow/IPFIX records from routers and switches using Cisco/Juniper/IPFIX formats. It processes and stores this granular flow data while maintaining strong performance even with very high traffic loads. NfSen supports multiple output formats and integrations like MySQL, PostgreSQL and Flat Files. Its browser-based reports deliver insight into bandwidth usage by host, application protocol, geographical location and more. NfSen also calculates important flow metrics like top talkers, top ports and traffic volumes. For deep packet inspection without intense hardware, NfSen empowers Linux admins with software-based network flow analytics.
SNMP Client (snmpget/snmpwalk/snmpset)

Sometimes the simplest tools get the job done best. Linux provides effective SNMP client utilities right in base operating system packages. Snmpget queries SNMP agents and retrieves single data values defined in MIBs. Snmpwalk performs a table walk, returning all data for a specific subtree. Snmpset modifies values on remote devices. These utilities allow Linux administrators to perform manual SNMP checks on routers, switches, printers or other networked devices. They offer an alternative for ad-hoc tasks when more full-featured GUI tools aren’t needed or present integration challenges. The SNMP utilities deliver readable text-based output and provide the nitty-gritty flexibility required by seasoned Linux admins for direct device control.
Conclusion
In conclusion, Linux offers a wide array of powerful yet user-friendly tools for network monitoring, configuration and management. By leveraging open source options like Nagios, Munin, Zabbix and Cacti alongside commercial-grade alternatives, Linux admins equip themselves with best-in-class solutions. They gain visibility, control and insight throughout entire infrastructure stacks. The tools highlighted here cover all key network administration roles from monitoring availability and performance to visualizing traffic patterns to configuring devices. By selecting the right mix customized for their unique environments, Linux network engineers can optimize operations with streamlined, cost-effective software.


