Last Updated on May 24, 2024 by Jhonni Jets
With Linux, you have complete control and visibility over your system’s resources. This level of transparency allows you to optimize performance and catch issues before they impact users. However, without the right tools, it can be difficult to get a granular view into how resources are being used. Resource monitoring applications give you insights into CPU, memory, network, storage and more so you can ensure everything is running smoothly.
In this article, we’ll explore 10 of the best Linux apps for monitoring system resources. Each tool has its own strengths, so understanding their different capabilities can help you choose the right fit for your infrastructure and needs.
Table of Content
1. HTOP
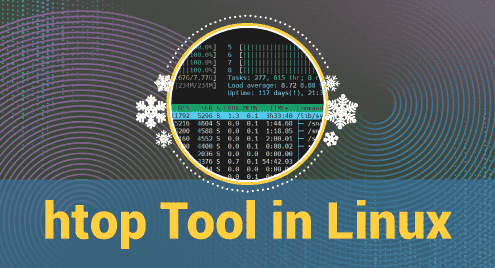
Htop is a simple CLI tool that provides an interactive textual interface for viewing system resources in real-time. Some key features include easy monitoring of CPU usage, memory, swap, open files and more on a per-process basis. You can sort columns by CPU, memory, runtime and more to quickly identify resource hogs. Htop also supports Linux containers so you can view processes running inside Docker and Kubernetes.
Being a CLI tool, htop has a very small memory footprint. It’s ideal for getting quick insights on remote servers without installing additional software. The interface is also easy to navigate and you can perform actions like killing processes directly from within htop. While it lacks some advanced features of GUI tools, htop is one of the most useful basic process monitoring utilities for Linux.
2. Glances

Glances brings some of the power of htop to the desktop with a simple graphical interface. It provides an overview of key system health metrics including CPU, memory, disk and network usage. Unique features include a dashboard view that organizes stats by category for easy scanning. Glances also supports plugins to monitor additional aspects like temperatures, specific services and logs.
The interface is cleaner and more visually appealing than htop. Additional information is displayed like graphical bar charts for at-a-glance monitoring. Glances refreshes automatically so you always see real-time changes. It has low hardware requirements and a small memory footprint too. For simple desktop monitoring without complex configurations, Glances is a great lightweight option.
3. Netdata
Netdata is one of the most full-featured open source monitoring systems for Linux. It collects hundreds of metrics across systems, apps, databases and networks. Unique capabilities include agentless monitoring via embedded plugins and extremely fast data collection frequencies down to 0.1 seconds. This level of granularity allows spotting issues as they happen.
The interactive web-based dashboard provides an enormous amount of built-in charts, graphs and metrics. Advanced alerting, notifications and reporting features are included as well. Netdata also supports remote monitoring of other servers via nodes. Overall it offers unprecedented insight into resource usage while retaining low overhead. For demanding environments like large infrastructures or production servers, Netdata is extremely powerful.
4. Prometheus
Prometheus is a widely popular open-source monitoring system and time series database. It features a highly flexible data model and multi-dimensional data collection enabled by a simple metric structure and query language. Prometheus scrapes metrics from services via an exporter interface and stores timestamped metric values internally.
What sets it apart is its multi-dimensional data model and powering of many observability stacks. Prometheus integrates smoothly with Grafana for visualization, Alertmanager for alerts and many exporters for collecting almost any system or application metric. It has excellent scalability and is ideal for larger and more complex infrastructures. Prometheus provides the backend monitoring database that many companies rely on for robust data collection and querying.
5. Munin

Munin is a classic choice for monitoring Linux servers. It takes a simple agent-based approach where nodes report specific plugins and metrics to a central Munin master server. The master then collects and stores this historical data. Munin provides easy to read graphs displaying system performance over time via its web-based interface.
Common metrics include disk space, memory, CPU and network usage. Plugins can be added for anything needing oversight. Munin is lightweight, stable and easy to install. Its strength lies in being able to quickly visualize trends in dozens or even hundreds of servers simultaneously. It remains a popular choice for smaller monitoring deployments due to its simplicity and reliability.
6. Icinga
Icinga is a powerful open-source monitoring solution build upon Nagios. It provides all the core features of Nagios with improved performance, scalability and a more modern interface. Icinga allows defining checks, thresholds and alerts for servers, applications, networks and other IT infrastructure components.
Checks are executed by Icinga agents which report states and metrics back to a centralized server. Notifications can be sent by various channels upon critical issues. Logs, reports and historical data are easily accessible via the web interface. Template wizards simplify configuring new checks. Icinga’s flexible architecture supports scaling to monitor thousands of resources. Its robust feature set makes it suitable for medium to large-sized environments.
7. Zabbix
Zabbix is another full-fledged enterprise-grade option with agent, agentless and passive monitoring capabilities. It collects metrics via installed agents, SNMP, IPMI, SSH, web monitoring and more. Zabbix excels at monitoring traditional infrastructure like servers, networking gear and applications.
Its easy to use web-based frontend provides visualization of metrics, events, maps and network diagrams. Custom checks and triggers can detect and report on almost any parameter. Advanced alerting, reporting, trend analysis and predictive maintenance are built-in. Zabbix also incorporates IT service and asset management. Overall it offers a comprehensive feature set for monitoring complex heterogeneous environments.
8. Nagios
Nagios is the grand-daddy of open-source monitoring tools and many modern solutions are based upon its core principles. It takes a simple but powerful agent-based approach and checks services/resources by having agents periodically query server processes and report statuses. Nagios receives these status updates and is responsible for alerting.
The interface shows current and historical states of all monitored components in an easy to parse format. Custom plugins can monitor anything needing oversight. Nagios is highly extensible, scalable and stable for use in enterprise deployments. It’s especially suitable for monitoring availability and basic metrics rather than high-level visualizations.
9. Cacti

Cacti is a popular open-source network monitoring and graphing solution relying on RRDTool for storing data in round-robin databases. It collects metrics from systems and network devices via simple SNMP, IPMI and local shell scripts. These are graphed and trended historically over time in the frontend.
Cacti provides an easy way to visualize trends in things like traffic volumes, device temperatures and more. Its data correlation and graphing capabilities are excellent for capacity planning and troubleshooting bandwidth usage. Configuring new monitoring templates is straightforward. Cacti remains a veteran choice for lightweight network and infrastructure monitoring.
10. PANIC

PANIC or Process and Network Monitoring System refers to a lightweight PHP/MySQL-based monitoring solution. It collects data via check_mk agents running on machines and stores this in a database. The clean web interface then presents this information through network maps, dashboards and reports.
Key features include host/service discovery, flexible hierarchy views for large environments, dependency mapping and SLA monitoring. It also offers alerting, automation, templates and a web API. PANIC strikes a good balance of being full-featured without overheads of bigger platforms. For smaller teams, its ease of installation and usage makes PANIC a practical monitoring choice.
Conclusion
Choosing a Linux resource monitoring tool depends on factors like environment size, requirements, budget and team skills. The options above cover everything from basic command line tools to full-fledged enterprise platforms. While each tool has a different area of strength, they all allow understanding resource utilization to optimize performance.
Lighter solutions like Htop, Glances and Munin work great for smaller workloads and non-critical systems. For demanding production environments needing visualizations, alerting and flexibility, Netdata, Prometheus, Zabbix and Icinga provide high-powered monitoring. Understanding the strengths of each tool will help decide the best fit to maintain Linux infrastructure health.

