9 best data analytics tools for marketers
Last Updated on May 23, 2024 by Jhonni Jets
Data analytics has become increasingly important for marketers to gain valuable insights, understand customer behaviors, and improve marketing strategies. With so many data analytics tools on the market, it can be difficult for marketers to determine which tools are best suited for their needs. This guide will explore the 9 top data analytics tools used by marketers today and how each one can help optimize campaigns and drive better business outcomes.
Data analytics allows marketers to collect, analyze, and visualize customer data to gain deeper customer understanding. By leveraging data, marketers can identify trends, pinpoint opportunities for growth, and create hyper-targeted campaigns. The right analytics tools enable marketers to make strategic, data-driven decisions that boost key metrics like conversions, loyalty, and lifetime value.
Table of Content
This guide profiles the 9 most effective data analytics tools currently used by marketing teams. The tools were selected based on features, ease of use, popularity in the marketing community, and ability to deliver actionable insights. Each tool is briefly described along with its main uses and benefits for marketing. The goal is to help readers determine which solutions best fit their specific analytics needs and budgets.
By choosing the right analytics tools, marketers can optimize every stage of the customer journey from acquisition to retention. Data provides the foundation for more personalized, impactful campaigns that strengthen customer relationships and drive tangible business results.
Google Analytics

Google Analytics is one of the most widely used web analytics services, offering marketers powerful insights into website and app traffic and behavior. As a free basic tool, it provides data on metrics like sessions, users, pageviews, bounce rate, and device usage. Marketers can segment traffic sources to see which channels are driving the most qualified leads and sales.
Advanced features like Goals and Funnels give marketers visibility into conversions and the customer journey. Custom dimensions and metrics allow integrating third-party tags for a more holistic view. Google Analytics 360 takes this a step further with extras like attributions analytics, data export, and integration with Google Ads and Optimization.
The intuitive interface, visualizations, and extensive documentation make Google Analytics easy for novices to pick up. Data is synced automatically from Google tags for setup convenience. Marketers appreciate being able to easily understand traffic patterns, measure campaigns, debug issues, and spot engagement opportunities across all digital properties.
With such widespread use, Google Analytics provides a standard foundation for analytics that other tools can build upon. Its integration capabilities also allow combining with additional platforms for even deeper insights.
Segment

Segment gathers and unifies customer data from all sources like Google Analytics and sales tools in a single location. This Customer Data Platform (CDP) empowers marketers to gain a 360-degree view of each individual through identifiers like email addresses. Teams can then activate this enriched customer profile data across a wide range of marketing platforms.
Segment makes it simple to push data between tools while applying privacy permissions, compliance rules, and data governance policies. So marketers retain ownership and control of their first-party data while delivering personalized experiences. Its code-free design means technical teams aren’t required for basic setup or ongoing integrations.
Key capabilities include automatically syncing data in real-time, batch-processing historical data, and modeling audiences for targeted campaigns. Marketers can build accurate user profiles that power 1:1 personalization across channels like ads, email, mobile apps, and websites. Advanced segments and triggers enable contextual, rules-based marketing automation.
Pricing depends on data volume processed. But for many mid-market businesses, Segment delivers significant value as a primary data orchestration layer. It takes the pain out of data management so marketers can retrieve clean customer profiles whenever needed in other tools.
Adobe Analytics

Adobe Analytics (formerly Analytics) provides extensive web, mobile, and cross-device analytics. It offers a robust feature set for understanding customer behavior, with capabilities ranging from standard traffic metrics to predictive modeling and multivariate testing. Marketers gain a unified view of the customer experience spanning sites, apps, videos, and digital ads.
Reporting and dashboards are highly configurable, with visualization options like charts, maps, and custom reports. Segmentation facilitates analyzing specific key variables and personal traits. Marketers can easily dig into segments like high-value users, top spending regions, or channels that drive repeat visits.
One major strength is its tight Adobe Experience Cloud integration, allowing marketers to analyze end-to-end digital experiences and attribute outcomes to the right touchpoints. Features like customer profiles, real-time metrics, predictive personalization, and test-and-learn workflows further inform cross-channel strategies.
Adobe Analytics is best suited for large enterprises with deep analytics needs. Its premium pricing may exceed smaller budgets. But for major brands seeking advanced 360-degree customer insights, it delivers an empowering set of data-driven marketing capabilities.
Mixpanel
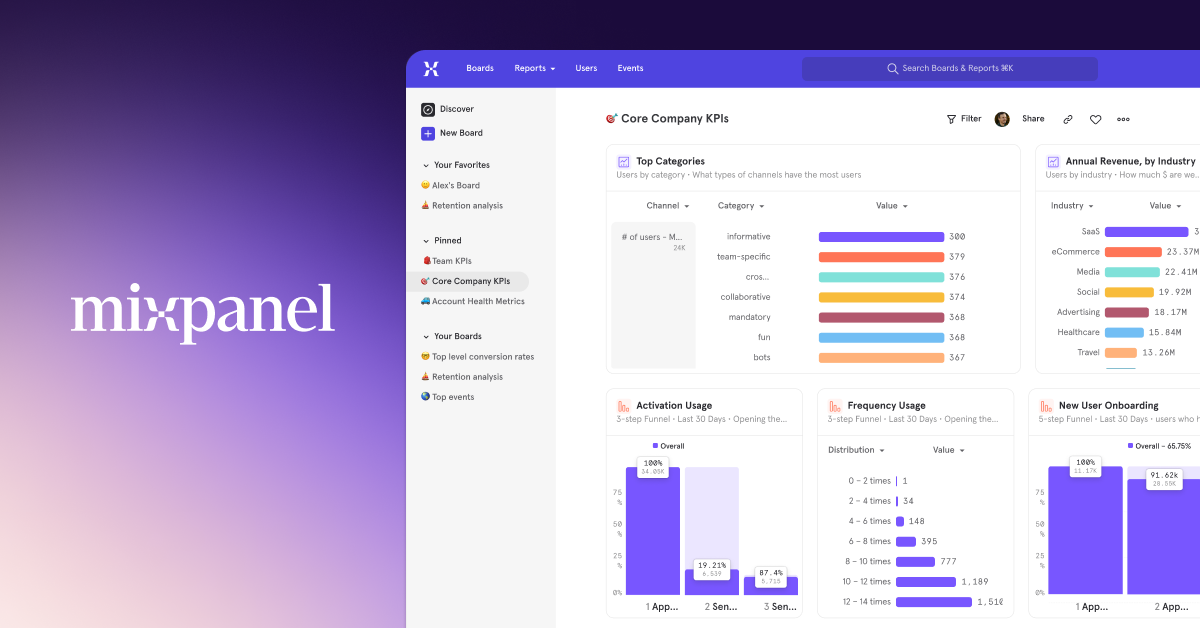
Mixpanel excels at product analytics, allowing engineers and marketers to jointly analyze user behavior and optimize the digital product experience. Its interface models the actual product flow, so teams can quickly uncover struggles, drop-off points, or variations between cohorts directly from the diagram.
Powerful segmentation and filtering allows isolating specific user trails to answer questions like “what causes new users to become loyal customers?”. Custom events give insight into task completions, button clicks, error occurrences and more. Its Predictive Intelligence leverages machine learning to detect at-risk users before they churn.
Marketers will find Mixpanel suitable for measuring campaigns and accurately attributing their impact on engagement and retention. Its integrations with Google Analytics, Segment and Amplitude allow stitching product behavior to external traffic sources and profiles. Insights can then guide successful user acquisition strategies.
Offering standard and unlimited plans, Mixpanel is cost-effective even for startups and SMBs. Its developer-friendly nature allows marketing and product teams to closely collaborate on user-centric initiatives across the full lifecycle.
Tableau
Tableau excels at data visualization, making it a top choice for marketers seeking to visually tell stories with their data. An intuitive drag-and-drop interface empowers users at any skill level to quickly transform raw numbers into colorful dashboards, maps, charts and other engaging formats.
Connectors import data from over 60 sources including Google Analytics, Salesforce, QuickBooks and more. Custom SQL queries also facilitate analyzing disparate data sets side by side. Advanced features include calculated fields, sets, and LOD expressions to slice data in customized views.
Tableau offers both desktop and server (cloud) options, so marketers gain flexibility in authoring visualizations locally or publishing securely to a centralized portal. Interactive functionality incorporates tooltips, filters and dynamic views for immersive data exploration.
Visualization templates help get insights to stakeholders in a format tailored to their role, whether executive summaries or worker-level scorecards. Tableau’s storytelling capabilities deliver memorable presentations of strategic findings.
Marketers benefit from Tableau’s usability and ability to distill numbers into visuals that convey trends and opportunities at a glance.
Amplitude

Amplitude takes a product analytics approach similar to Mixpanel, focusing on digital product optimization through user behavior tracking. Its interface also maps the actual product or app flows for intuitive understanding of user paths.
Advanced event modeling allows uncovering patterns across user sessions and cohorts over time. Cohort analysis compares adoption and retention rates between groups. Its Predictive Analytics furthers Mixpanel’s lead with automatic detection of predicted events like subscriptions or purchases based on prior user behavior.
Amplitude aims to eliminate typical analytics setup complexities. Its code-free, customizable SDKs insert minimal tags across platforms including mobile and web. Automatic data collection and insights require little IT involvement beyond original integration.
Features like Engagement API, Live User Profiles and Predictive Insights allow marketers to pair behavioral data with user attributes for fully personalized campaigns. Its customer success team provides professional services to help maximize value.
More affordable than some competitors, Amplitude remains cost-effective for mid-market businesses seeking precise behavioral analytics without extensive development resources.
Microsoft Power BI

Power BI from Microsoft delivers self-service business analytics and interactive dashboards. With access to over 500 pre-built connectors, marketers can pool customer, sales, employee and IoT data from any source. That includes major platforms like Azure, Dynamics 365, Office 365 and popular SaaS applications.
An intuitive interface allows users to perform guided data transformations, join multiple sources, and visualize results through intuitive drag-and-drop interactions. Charts, cards, maps and custom visuals surfaces insights for any audience type.
Natural language queries (Q&A) facilitate exploring data even without SQL knowledge. Automated AI insights identify unexpected patterns. Marketing teams gain an integrated view across enterprise-wide operational and customer behavioral metrics.
Power BI operates both in the cloud (Power BI Online) and on-premises for added control over sensitive information. Its mobile apps for iOS and Android plus embedded analytics capabilities surface insights wherever crucial business decisions occur.
Its value includes rich collaboration features that foster data-driven behaviors across all departments. With native Office integration, results seamlessly influence reports and presentations as well.
Power BI remains a top choice for comprehensive analytics throughout entire organizations of all sizes.
Chartio
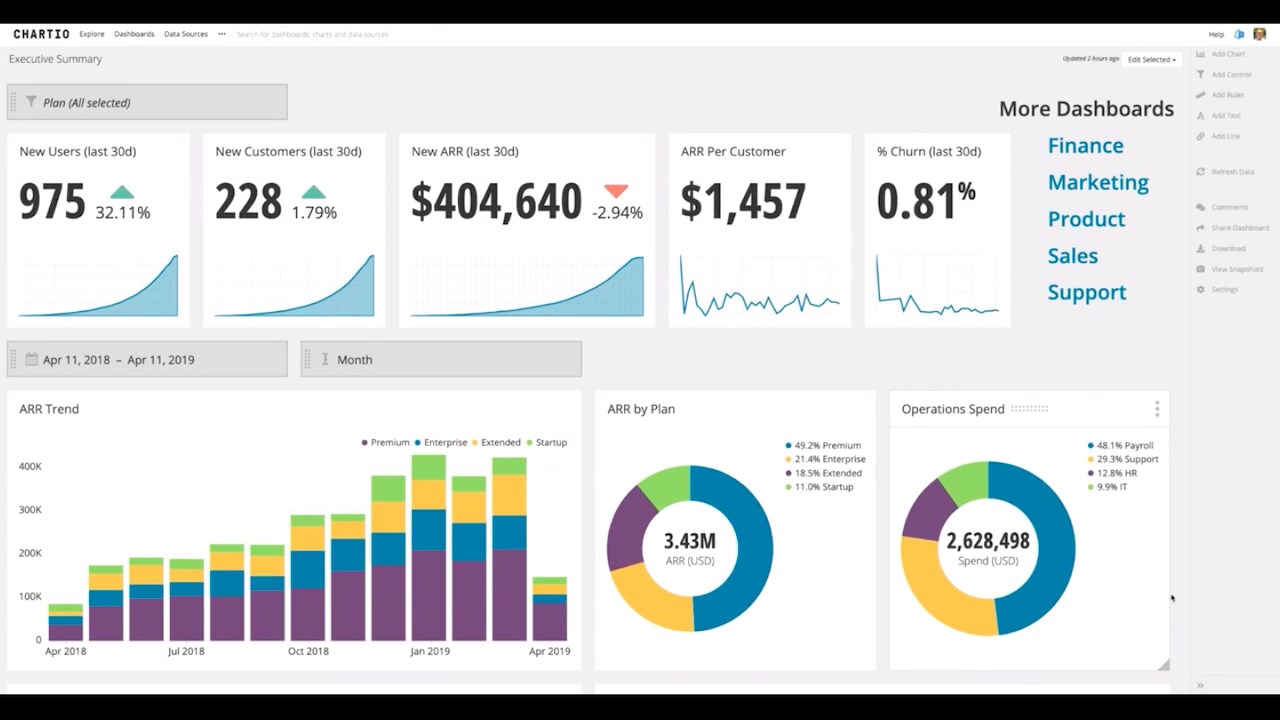
Chartio caters primarily to SaaS and subscription businesses seeking insights into retention, churn, expansion, and lifetime value (LTV). Its core charts like engagement funnels, cohort analyses and retention curves specifically analyze recurring revenue metrics over time.
Connectors automatically ingest data from platforms like Stripe, Chargebee, Zuora and Pendo. Custom objects support bringing in additional sources as well. The no-code builder easily transforms and joins multiple datasets for unified analysis.
Marketing teams gain KPI visibility like conversion rates, MRR contribution by source, and campaign ROI over sequential periods. Dashboards incorporate key retention and expansion milestones to gauge marketing health.
Chartio excels at surfacing forecasting indicators that model future cash flows, predict at-risk accounts, and determine ideal upsell/cross-sell windows. Its advisory services then help optimize marketing programs informed by these behavioral patterns.
Integration with tools such as Amplitude or Mixpanel pairs individual usage behaviors with billing transactions. Suitable pricing tiers accommodate all subscription business models whether B2B SaaS startups or larger enterprises.
Its laser focus on recurring revenue makes Chartio a stand-out choice for any business generating ongoing income streams from customers.
Custora

Like Chartio, Custora prioritizes recurring billing businesses, with a dedicated focus on customer health, churn risk predictions and maximizing retention.
It aggregates and unifies transactional data from finance systems like Zuora, payment gateways, CRM and support tools to form a unified customer profiles. AI-driven analytics then scores each customer’s propensity to churn, expand or remain loyal over time.
Early churn warnings alert marketers to at-risk accounts requiring recovery campaigns or upsell opportunities. Simulations forecast response rates to different program variants. Recommendations suggest timely, personalized touches shown to minimize attrition for that customer type before it occurs.
Custom dashboards and reports can segment customers into specific buyer personas. Drilldown views showcase individual revenue attribution and loyalty metrics over the lifetime with an organization.
An integration library links Custora with marketing automation, messaging and billing platforms. Its prescriptive retention playbooks advise the most impactful tools and messages for any given risk scenario.
Custora delivers remarkable clarity around recurrence threats alongside action plans proven to extend valuable customer relationships for subscription businesses of any scale.
Conclusion
All businesses rely on insightful data to guide crucial marketing decisions. But with so many analytics options, choosing tools requires understanding specific needs and desired outcomes. This comparative guide profiles the 10 leading solutions that deliver the deepest intelligence marketers require.
Whether assessing website or app behavior, optimizing digital experiences, profiling customers, or predicting revenue patterns – these tools empower meaningful analysis. Their integration capabilities also allow mixing and matching for a complete view that no single platform provides alone.
The right analytics companion frees marketers from data limitations to instead focus energy on strategic planning, campaign testing, and personalized programs that deepen engagement and increase value over the long term. Prioritizing tools with the features and ROI potential best aligned to individual objectives ensures data serves its fullest purpose.

