9 best Linux apps for server management
Last Updated on May 27, 2024 by Jhonni Jets
Linux servers power some of the biggest sites on the internet. Whether you’re running a small home server or a large cloud infrastructure, installing the right server management tools is key to keeping your systems secure, up-to-date, and running smoothly. This article explores 9 top open source Linux apps for monitoring, deploying, and managing servers.
Nagios – Powerful Monitoring Solution
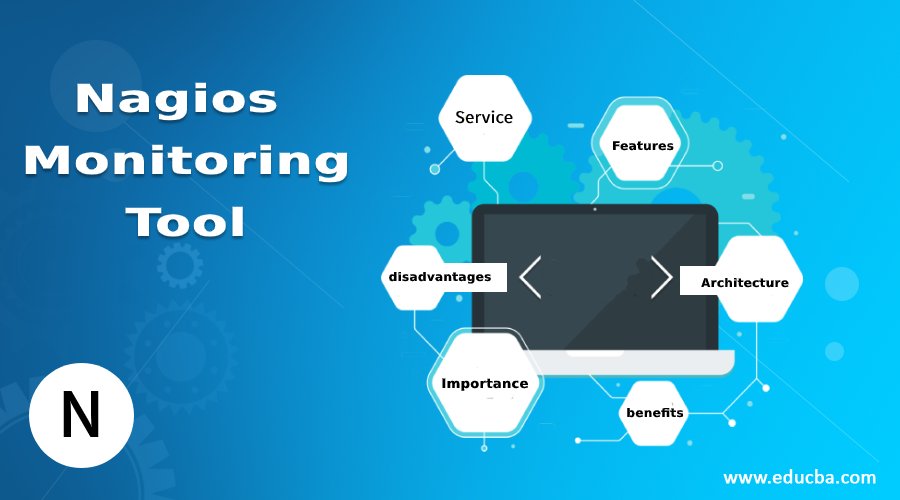
Nagios is one of the most fully-featured and customizable server monitoring solutions available for Linux. With Nagios, you can monitor server resources like CPU load, memory usage, disk space, network traffic and more. You can also monitor the status of services, daemons and apps running on servers.
Nagios supports monitoring both local and remote hosts via SSH, SNMP or other protocols. Its plug-in architecture allows for easy expansion – there are thousands of third-party plugins that extend its capabilities. Alerts can be sent via email, SNMP traps or other channels when issues emerge. Nagios also integrates reporting and powerful visualization tools like map views of your infrastructure.
The basic Nagios package is free and open source. For large or complex deployments, there are also commercial support packages available from the Nagios developers. Nagios requires some configuration, but it offers unparalleled power and flexibility for server monitoring at all scales.
Zabbix – Robust and Scalable Monitoring
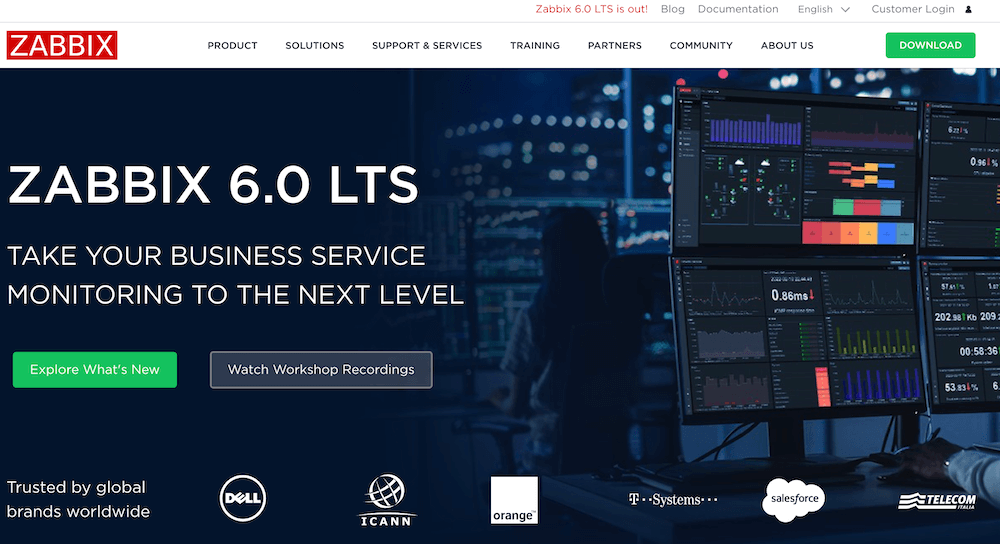
Zabbix is another open source monitoring solution comparable to Nagios in capabilities. It uses a client-server model to monitor the availability and integrity of servers, networks and various services and applications. Zabbix supports both agent-based and agentless monitoring via SNMP, IPMI, JMX and other protocols.
Where Zabbix excels compared to Nagios is its scalability. With built-in high availability, failover and load balancing features, Zabbix can easily monitor very large infrastructures with thousands of devices. Popular enterprise features like distributed monitoring, scalable web interfaces and reporting are supported out of the box. Configuration is easy via an intuitive web-based frontend.
Zabbix also has a robust alerting system and can integrate with external tools like PagerDuty. Templates make it straightforward to apply standard monitoring configurations to new hosts as they’re added. Overall, Zabbix is a full-fledged commercial-grade monitoring platform that scales well for even the largest organizations.
Prometheus – Time-Series Monitoring

Prometheus stands out from Nagios and Zabbix by taking a time-series approach to infrastructure and application monitoring. It scrapes and stores performance data from instrumented servers, containers and services over time. This time-series data then enables powerful graphing, alerting and analytics capabilities in Prometheus.
Prometheus has a simple, language-agnostic exposition format called Prometheus Exposition Format (PBF). This allows it to instrument metrics from almost any application with little code change. It integrates with Kubernetes and containerized microservices applications seamlessly. Prometheus is highly configurable, with an expressive query language for examining metrics in real-time.
Alerting rules are configured via a declarative and reactive configuration similar in style to Ansible or Kubernetes. Prometheus supports both pulling and pushing data, making it suitable for both infrastructure monitoring and external service monitoring use cases. Large deployments often combine Prometheus with Grafana for visualization.
Grafana – Powerful Visualization
While Prometheus excels at collecting and storing time-series data, Grafana is often used alongside it for intuitive visualization and dashboarding capabilities. Grafana supports over 30 different data sources including Prometheus, InfluxDB and Elasticsearch. It provides beautiful, highly customizable graph types as well as table, heatmap and pie chart widgets.
Pre-built dashboards plugins are available through Grafana’s extensive dashboard library. Teams can collaboratively build and share custom dashboards. Notifications and complex alerting rules can also be configured directly in Grafana without external tools. Dynamic dashboard templating and multiple authentication options enhance Grafana’s flexibility.
Grafana has become very popular not just for infrastructure metrics but also application logs, database metrics and more. Its ease of use and powerful visualization makes Grafana invaluable for monitoring complex, hybrid environments where multiple data sources need to be integrated onto centralized displays.
Ansible – Configuration Management
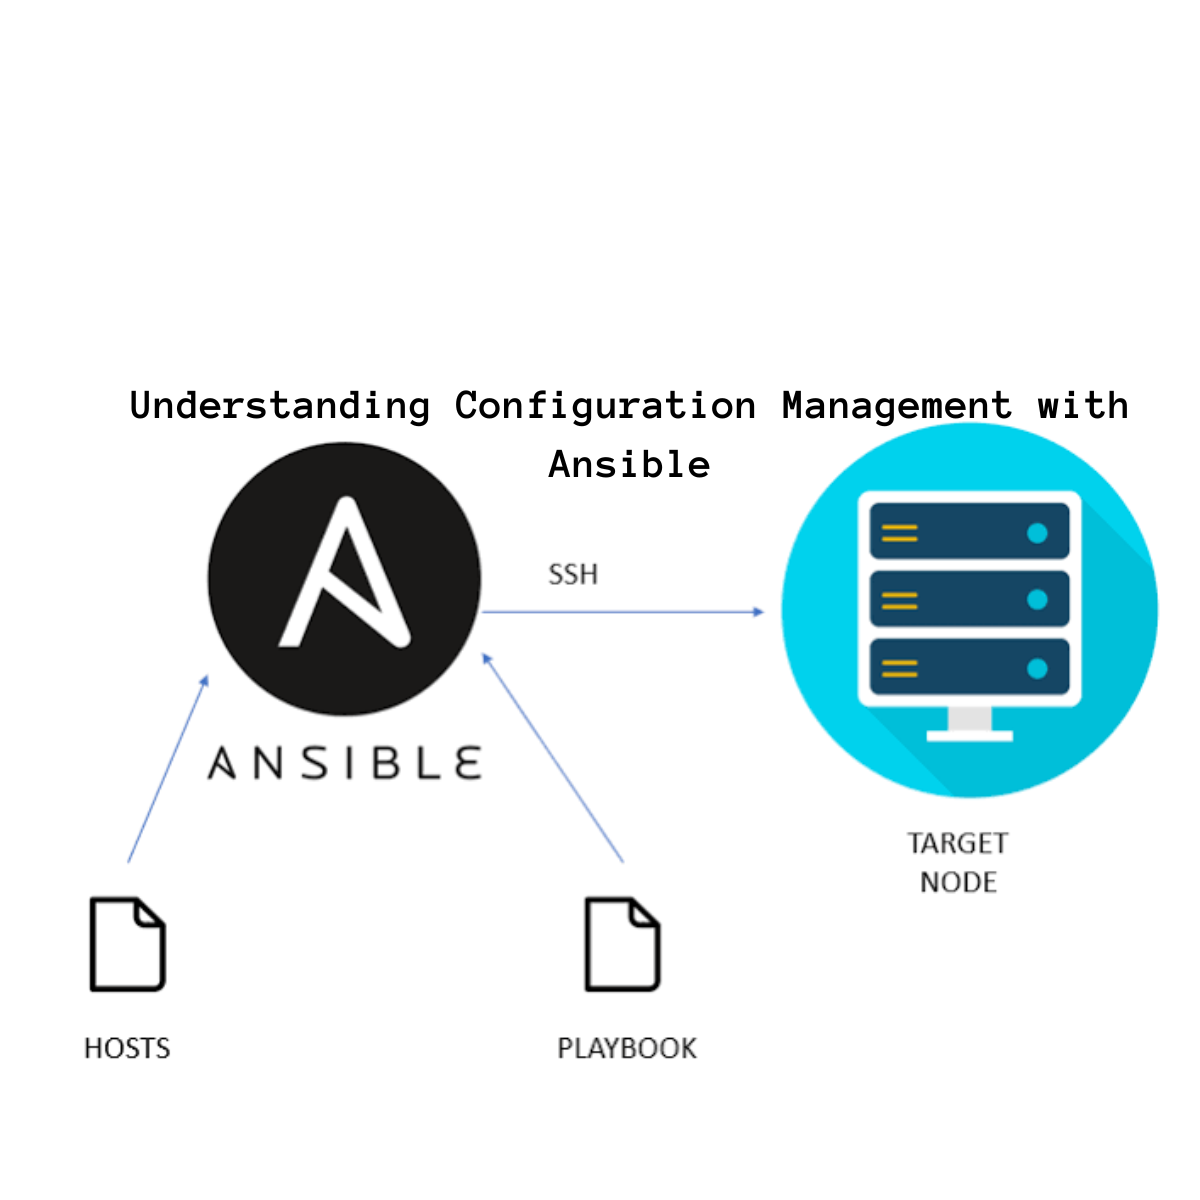
Ansible is one of the most popular configuration management and infrastructure as code tools available. It uses YAML files and a simple agentless architecture to deploy applications, update configurations and automate other IT tasks across servers.
With Ansible, you define server configurations, software installations and security policies in reusable “playbooks”. These are idempotent and declarative, making it easy to deploy standard environments consistently at scale. No specialized agents are required – Ansible leverages SSH and other standard OS tools.
Roles, templates, variables and conditionals make Ansible playbooks very flexible and reusable across environments. It integrates tightly with source control systems, allowing full policy versioning. Roles support separation of concerns across team members. A large library of existing modules expedites common setup tasks.
Ansible AWX and Tower platforms provide web UIs, job scheduling and role-based access controls for team-based Ansible management. For a full-featured automation and orchestration suite, Ansible delivers reliability and immense power with a minimal learning curve.
Puppet – Mature Configuration Management

Puppet is an influential pioneer in the configuration management field. Like Ansible, it uses declarative “manifests” and modules to define the desired state of systems. But while Ansible uses ad-hoc tasks and playbooks, Puppet takes a more agent-based approach with its master/agent architecture.
Puppet brings mature capabilities like defined types and providers that extend well beyond basic configuration duties into full-fledged application deployment. It focuses more on low-level configuration details and is extremely granular in adjusting system states. Huge, complex infrastructures can be modeled with Puppet’s powerful language.
Puppet also integrates deeply with administrative tools via facts, file editing, packages and more. Its ecosystem contains extensive extensions for custom coding, additional node sources and external function calls. Commercial Puppet offerings provide robust scalability, auditing, compliance and remediation features.
For mission-critical server environments and highly-customized configuration needs, Puppet remains unrivaled in depth and precision. It comes at the cost of a steeper learning curve than Ansible but earns its place among elite configuration veterans.
SaltStack – Scalable Automation

SaltStack is another leader in the configuration management space, known for its power, scalability and flexibility. Like Puppet, it uses a master/minion architecture and leverages a high-level programming language for defining states and executions. But SaltStack implements a lightweight TCP-based transport instead of relying on SSH.
This makes Salt fast and suitable for controlling high-latency or remote environments like large cloud infrastructures. Modules are written in Python, enabling advanced logic and complex configuration needs. A simple YAML format is also available for basic configuration jobs.
Salt features enormous scalability and a reputation for reliability even under enormous workloads. It supports distributed package repositories, virtual machine management and thin provisioning. A large standard module corpus accelerates tasks like database and mail server configuration.
SaltStack delivers good free editions and commercial subscription plans with expanded support, security and scale capabilities. It provides comprehensive automation suitable for heterogeneous infrastructures involving physical, virtual and cloud-based assets.
Docker – Container Management
Docker fundamentally changed infrastructure by popularizing application containerization. Its simple and flexible “build once, deploy anywhere” model revolutionized deployment practices. Now Docker is an essential tool for container management and orchestration.
With Docker, applications are bundled with all their dependencies into lightweight, portable container images. Images can be shipped as immutable infrastructure to any host running Docker. This consistency across environments ensures applications always behave the same way regardless of the runtime infrastructure.
The Docker CLI makes building, pushing, pulling and running containers quick and easy tasks. It handles all the messy application isolation details using containers as lightweight virtualization platforms. Integrated registries host public container catalogs as well as private image repositories.
Combined with swarm clustering and Compose orchestration, Docker builds fully automated infrastructure at scale. Kubernetes takes container orchestration further by providing full service definition and deployment automation from Docker.
Kubernetes – Container Orchestration
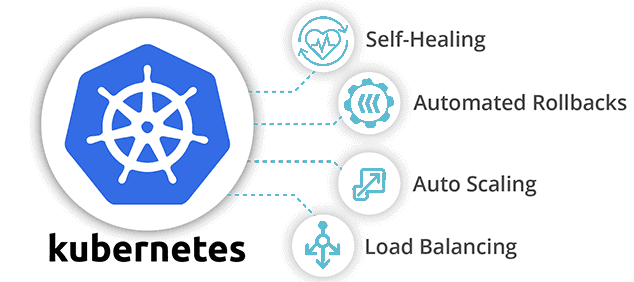
Kubernetes has become the dominant container orchestrator and paved the way for next-gen “cloud native” applications. It builds upon Docker to provide advanced features like replication, auto-scaling, rollback/restart, load balancing and more.
Kubernetes manages a “cluster” of Docker hosts (physical, virtual or cloud) as a single, elastic computer system. Applications are defined as portable “Kubernetes resources” using YAML files or a simple API. These describe desired application states and Kubernetes ensures they’re always maintained.
Kubectl provides the command line interface for building applications from multiple Docker images, exposing apps as services, rolling out updates and more. Kubernetes’ self-healing capabilities far surpass legacy infrastructures. It’s grown enormously popular with enterprises transitioning to microservices.
Open source Kubernetes delivers immense value, while CNCF members provide commercial support and additional tools. Kubernetes Masters the complex art of distributed container management with impressive scaling, failover and resilience that spawn innovative applications.
These 9 Linux server management applications represent some of the most widely adopted and full-featured open source solutions available today. Whether monitoring infrastructure, configuring servers or deploying applications, they enable exceptional automation, visibility and control over hybrid and cloud-scale environments.