10 best Windows apps for business intelligence
Last Updated on May 26, 2024 by Jhonni Jets
Business intelligence refers to technologies, applications and practices for collecting, storing, analyzing and providing access to data to help enterprises make better business decisions. In today’s data-driven world, business intelligence capabilities are essential for any organization that wants to gain insights from their data and optimize performance. While many business intelligence solutions are available as web-based services, having dedicated desktop applications can provide additional functionality and convenience for business users. This article highlights ten of the best Windows apps for delivering business intelligence and analytics capabilities.
1. Microsoft Power BI

Microsoft Power BI is one of the most full-featured and popular business intelligence tools available for Windows. Power BI allows users to connect to hundreds of popular data sources, clean and transform raw data, and build interactive dashboards, reports and data visualizations. Some key capabilities include intuitive drag-and-drop report building, an extensive library of charts and graphs, geographical mapping functionality, AI-powered natural language queries, and mobile apps for viewing reports on the go. Power BI also comes with a rich set of pre-built connectivity to Microsoft services like Excel, Azure SQL Database and Dynamics 365. Integration with the Power Platform allows building custom analytics solutions with Power Apps and Flow as well. While certain advanced capabilities require paid Power BI Pro licensing, the free Power BI Desktop client provides an impressive set of features for basic reporting and analytics needs.
2. Tableau Desktop

Tableau Desktop is one of the leading platforms for data visualization and advanced analytics. Some key strengths of Tableau include its ease of use for building visual analytics from diverse data sources, powerful data blending capabilities, and support for a wide range of chart types. Users can connect Tableau to databases, spreadsheets, cloud services and more. Interactive dashboards created in Tableau can be published to the Tableau Server for sharing, while the Tableau Reader application allows viewing dashboards without a full license. Tableau’s simple drag-and-drop interface hides much of the complexity of querying and preparing data, yet provides highly flexible chart customization for power users. Integrations are available for collaboration platforms like Microsoft Teams as well. While Tableau Desktop pricing is higher than some other tools, it provides a comprehensive set of features for advanced data analysis and visualization needs.
3. Qlik Sense

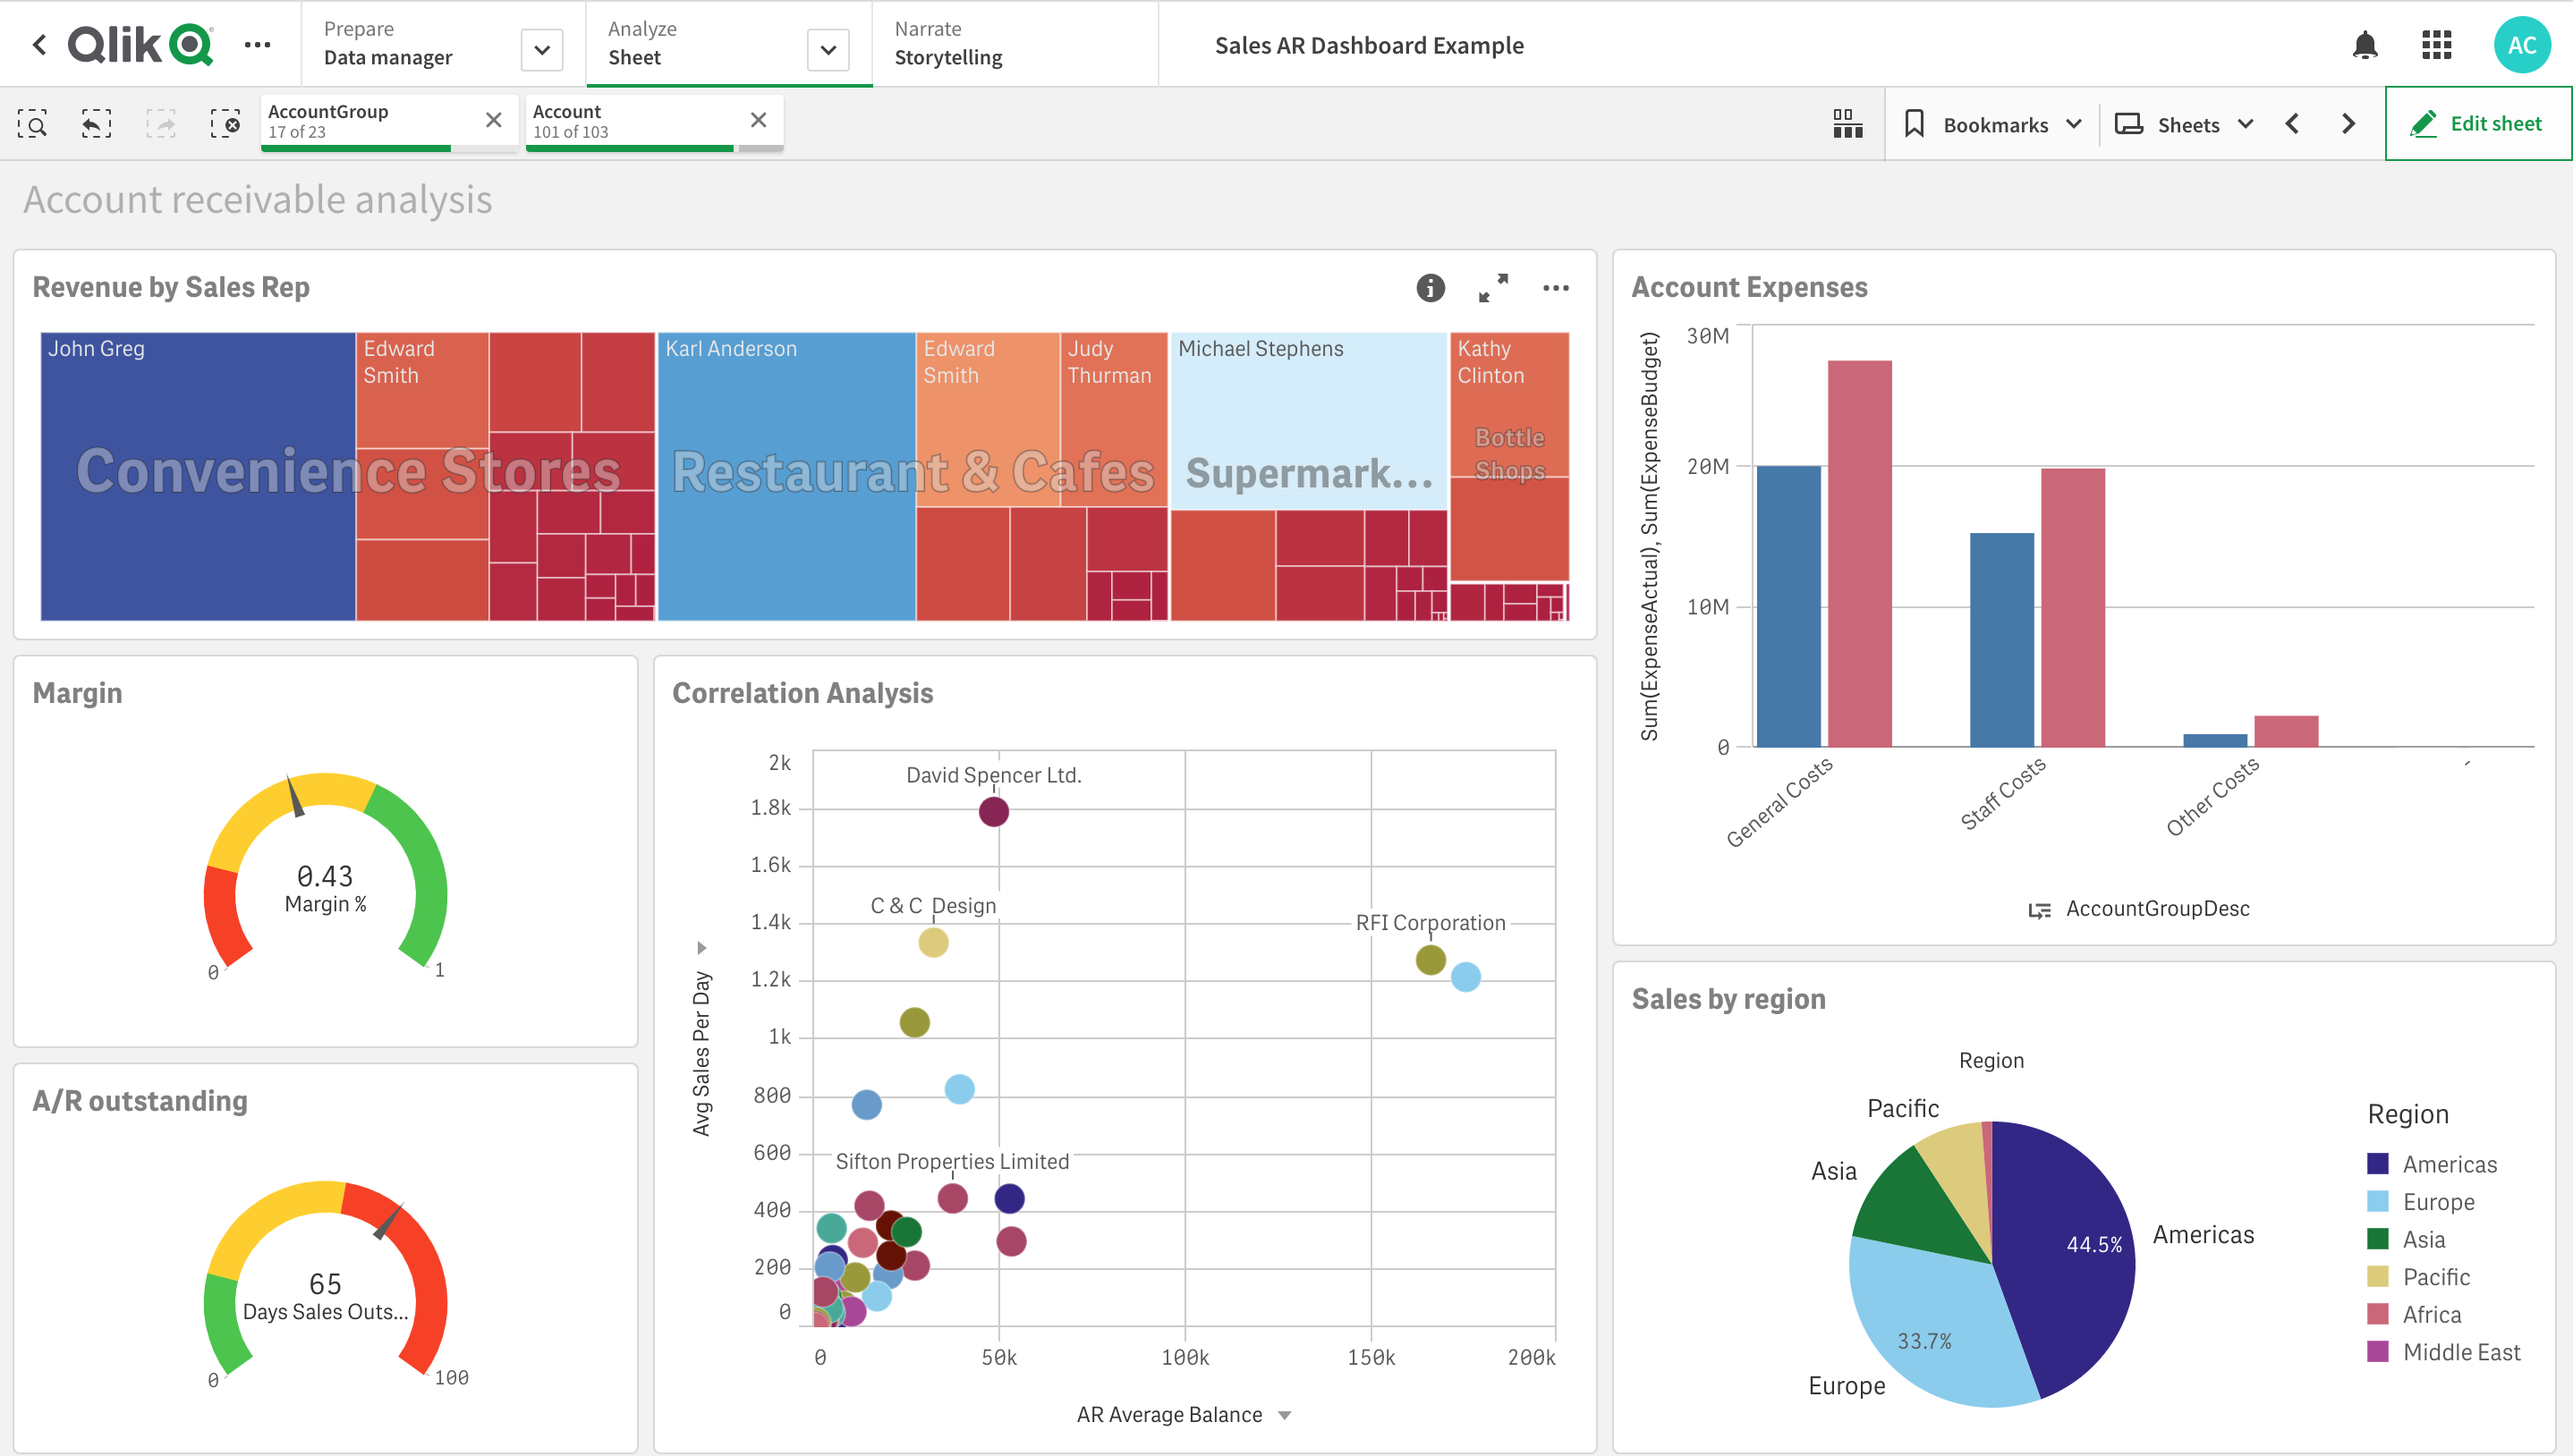
Qlik Sense is another top-tier business intelligence platform for intuitive data exploration, visualization and analytics. Some unique advantages of Qlik Sense include its associative data model which enables users to freely explore relationships between different data elements. The Qlik Sense hub offers a single interface to access various apps, documents, objects and more. The associative engine performs in-memory analytics for fast query response times. Interactive visualizations can be embedded into customized web pages or dashboards. Optional features like AI assistants, geo-spatial analysis and integration with workflow software expand its capabilities. Qlik Sense fosters collaborative, self-service business intelligence with features like in-app annotation and sharing of analysis. The desktop and web versions are fully synchronized to enable anywhere, anytime access. While the Qlik Sense platform does require some technical skills to set up and administer, it delivers high-end data analytics abilities for large enterprises.
4. Dundas BI

As a comprehensive business intelligence solution, Dundas BI provides reporting, dashboards, data visualization and analytical capabilities. It includes both a Windows desktop client and web portal for accessing reports and analytics. The intuitive interface hides the complexity of querying database schemas and transforming raw data. Users can easily build interactive dashboards with a variety of standard and custom chart types. Additional capabilities include an ad-hoc data analysis module, publishing reports for end users, and integration with the Power BI cloud service. While more limited than some other dedicated BI platforms, Dundas offers many powerful features in an affordable package suitable for small to mid-sized organizations. The drag-and-drop dashboard builder makes it accessible for non-technical business users as well. Regular updates keep enhancing its functionality to remain competitive among top Windows business intelligence tools.
5. SAP Lumira

SAP Lumira is a robust business intelligence visualization tool from SAP that provides out-of-the-box connectivity to various SAP applications and databases. Some key strengths of SAP Lumira include its intuitive yet powerful design environment for building interactive dashboards, stories and reports. Templates and wizards speed up the process of bringing data into stunning visualizations. Advanced analytical capabilities include predictive analytics, forecasting, simulation and planning algorithms. The open architecture supports connectivity to non-SAP data sources as well. Published content can be securely accessed via the Lumira web portal, as SAP Fiori apps or embedded into other systems. While geared more towards SAP customers, Lumira delivers a comprehensive set of reporting, visualization and analytical functions to enable complex data-driven decision making across the enterprise.
6. Jaspersoft BI

Formerly an independent open source project, Jaspersoft BI is now part of TIBCO and provides full-featured business intelligence and reporting capabilities. The Windows desktop studio offers drag-and-drop report design, an intuitive query builder, visualization features and publishing options. It connects to various data sources including databases, data warehouses, Hadoop, cloud services and more. Some advantages of Jaspersoft include its support for advanced visualization types, predictive modeling plugins, a centralized web portal for report consumption, and open source extensibility. While the free community edition has some limitations, the commercial versions deliver full-fledged enterprise reporting, dashboards and analytics. Jaspersoft focuses on accessibility for non-technical users yet also satisfies advanced technical needs through its robust feature set and customization options.
7. dbForge Studio for MySQL

While more focused than comprehensive BI platforms, dbForge Studio provides loads of powerful features for designing and exploring data within MySQL databases. The Visual Query Builder eases the creation of complex SQL queries using a drag-and-drop interface. Testing and optimizing queries is simplified through an execution plan viewer and query statistics. Data modeling tools enable designing conceptual, logical and physical schemas visually. Charts, reports and dashboards for analyzed data can be created using integrated visualization tools as well. Additional functionality includes a SQL code editor, debugging abilities, connection management and desktop database administration. While geared mainly towards MySQL, dbForge delivers an impressive array of tools to maximize the business value of critical MySQL data at an affordable price point.
8. BIRT Report Designer

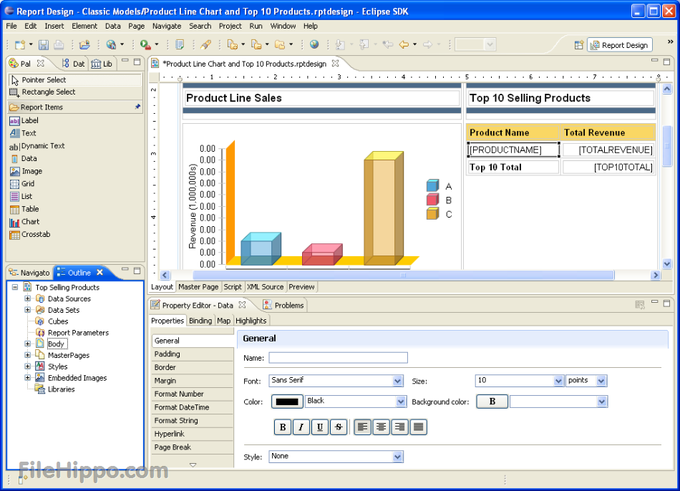
As an open source reporting tool, BIRT Report Designer provides robust functionality for technical users. Built-in connectors support over 20 different data source types. The report designer UI facilitates visually building page layouts, inserting charts, images and other report objects. Both static and interactive HTML reports can be generated. An eclipse-based code editor streamlines Java customizations or report extensions as needed. Additional capabilities include scheduling, distribution and embedding reports within web applications. While the learning curve may be steeper than some other options, BIRT offers high-level customization and extensibility prized by more technical users. Regular updates from the Actuate open source community keep advancing its feature set for delivering sophisticated reporting solutions.
9. Pentaho Data Integration

As part of the Pentaho business intelligence platform, Pentaho Data Integration (Kettle) supports complex ETL (extract, transform, load) workflows through a graphical pipeline editor. Pre-built transformation steps handle common tasks like filtering, joining, aggregating and transferring data between various enterprise systems and databases. The Windows client provides visual monitoring of running jobs as well as debugging and testing functionality. Integration with Pentaho reporting services makes generated data available for reports, dashboards and analysis. While more specialized than full-fledged BI tools, Pentaho Kettle excels at streamlining critical data preparation processes with its robust ETL capabilities.
10. Microsoft Excel

Despite some limitations for enterprise needs, Microsoft Excel remains a ubiquitous business intelligence platform thanks to its spreadsheet interface. With links to external databases and data analysis toolsets, Excel enables basic reporting, charting, visualization and summarization of business data. Standard and custom functions support calculations, formulas and what-if analysis. Pivot tables provide interactive slicing and dicing of datasets. Add-ins extend Excel with advanced statistical analysis, forecasting, dashboarding and other specialized BI features. Regular Microsoft updates keep improving Excel’s data modeling and visualization capabilities. While not a replacement for fully-featured BI software, Excel delivers value as an accessible self-service analytics tool for non-technical users.
Conclusion
The business intelligence landscape offers a wide variety of powerful desktop applications optimized for Windows environments. While cloud-based BI solutions continue gaining ground, dedicated desktop tools remain relevant for their additional functionalities such as complex data modeling, visualization customization, offline usage and deeper technical capabilities. This article highlighted ten top options ranging from free and affordable tools like Power BI and dbForge to fully-featured platforms like Tableau, Qlik Sense and SAP Lumira best suited for sophisticated enterprise needs. Choosing the right Windows business intelligence app depends on factors like available budget, technical skills, data sources, reporting requirements and integration priorities for an organization.


